
- Home
- About Us
-
News
- Company News
- Media Highlights
- Industry Information
- CR Group News
- Business
- Innovation
- IR
- Sustainability
-
Talent Development
- Talent Philosophy
- Talent Training
- Talent Recruitment


Financial Results
- Financial Overview
- Reports & Presentations
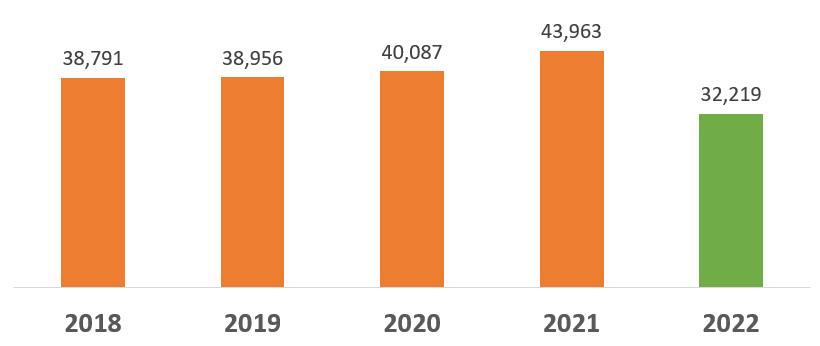
Turnover
(HK$ Million)
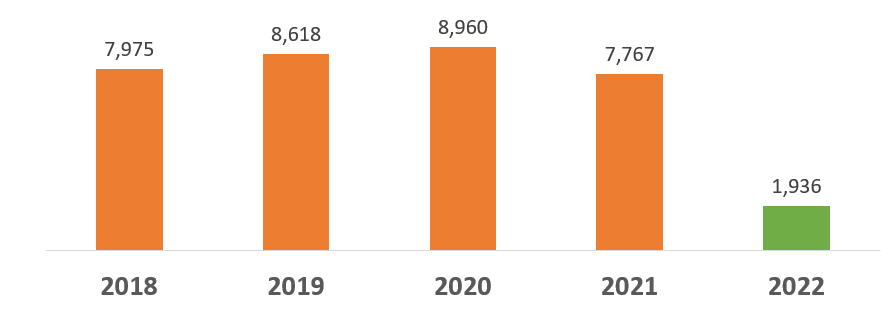
Profit attributable to owners of the Company
(HK$ Million)
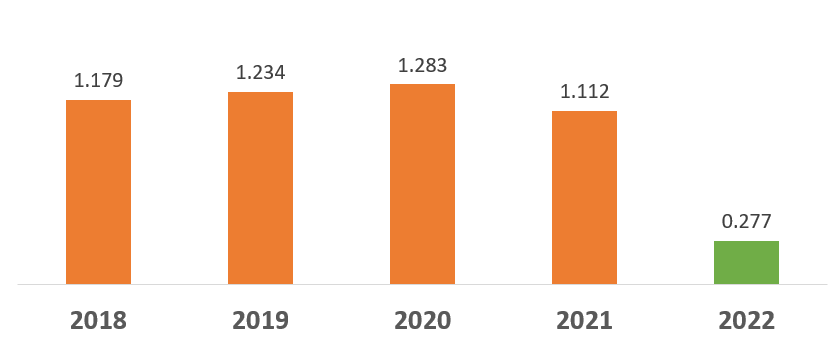
Basic earnings per share
(HK$)
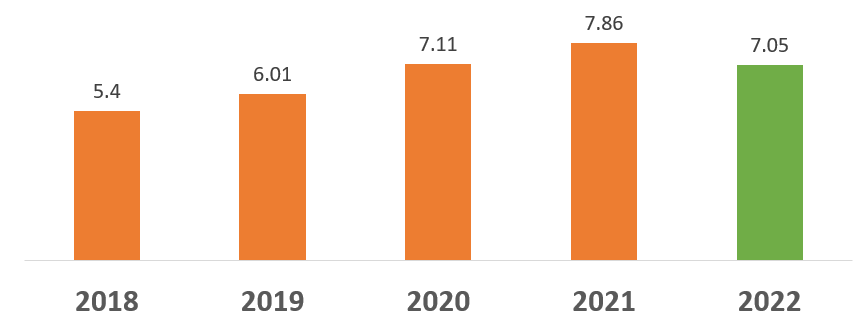
Net asset per share - book
(HK$)
| Consolidated Statement of Income | |||||
|---|---|---|---|---|---|
| Unit: HK$ Million | 2022 | 2021 | 2020 | 2019 | 2018 |
| Turnover | 32,219 | 43,963 | 40,087 | 38,956 | 38,791 |
| Cost of Sales | (27,300) | (29,840) | (24,451) | (23,298) | (23,371) |
| Gross Profit | 4,919 | 14,123 | 15,636 | 15,658 | 15,420 |
| EBITDA | 5,228 | 12,368 | 13,607 | 14,041 | 13,730 |
| Profit before Taxation | 2,282 | 10,291 | 11,893 | 12,008 | 11,335 |
| Taxation | (420) | (2,566) | (2,864) | (3,314) | (3,328) |
| Profit Attributable to Owners of the Company | 1,936 | 7,767 | 8,960 | 8,618 | 7,975 |
| Consolidated Statement of Financial Position | |||||
|---|---|---|---|---|---|
| Unit: HK$ Million | 2022 | 2021 | 2020 | 2019 | 2018 |
| Total Assets | 80,614 | 79,149 | 68,532 | 61,171 | 60,506 |
| Current Borrowings | 4,548 | 9,051 | 3,564 | 1,298 | 4,532 |
| Non-current Borrowings | 11,885 | 1,362 | 3,300 | 6,628 | 7,981 |
| Total Liabilities | 29,773 | 23,508 | 18,509 | 18,905 | 22,611 |
| Consolidated Statement of Cash Flows | |||||
|---|---|---|---|---|---|
| Unit: HK$ Million | 2022 | 2021 | 2020 | 2019 | 2018 |
| Net Cash Generated from Operating Activities | 3,170 | 6,034 | 10,268 | 11,285 | 11,331 |
| Net Cash Used in Investing Activities | (10,335) | (11,731) | (5,004) | (2,618) | (1,075) |
| Net Cash Used in Financing Activities | 2,696 | (755) | (5,688) | (7,837) | (2,803) |
| Cash and Bank Balances | 2,182 | 7,067 | 13,227 | 12,848 | 12,302 |
| Key Ratios | |||||
|---|---|---|---|---|---|
| 2022 | 2021 | 2020 | 2019 | 2018 | |
| Gearing Ratio (Note 1) | 33.4% | 19.0% | 13.8% | 18.9% | 33.2% |
| Net Gearing Ratio (Note 2) | 27.9% | 5.3% | -13.6% | -12.2% | 0.3% |
| Gross Margin (Note 3) | 15.3% | 32.1% | 39.0% | 40.2% | 39.8% |
| Profit Margin (Note 4) | 5.8% | 17.7% | 22.5% | 22.3% | 20.6% |
Note:
1.Gearing ratio is calculated by dividing the total bank borrowings and unsecured medium term notes by equity attributable to owners of the Company.
2.Gearing ratio is calculated by dividing the total bank borrowings, unsecured bonds, unsecured commercial paper and unsecured medium term notes by equity attributable to owners of the Company.
3.Gross margin is calculated by dividing gross profit for the year by turnover.
4.Profit margin is calculated by dividing profit for the year by turnover.

Mobile Official Website

WeChat Official Account